See it first.
Recover with a fix you can reverse.
Make sure it never returns.
One engine across all three tenses of an incident — it catches the failure from your first line of logs, with no rules to write, recommends a reversible fix to restore service, then drafts the cited root cause so it doesn't recur — across logs, metrics, traces, infrastructure, and RUM.
 the live demo — this exact screen, no signup →
One incident, three tenses — one engine.
One real incident, worked end to end — a retry storm holding a service down 14 minutes after its trigger cleared. The same incident is open in the live demo.
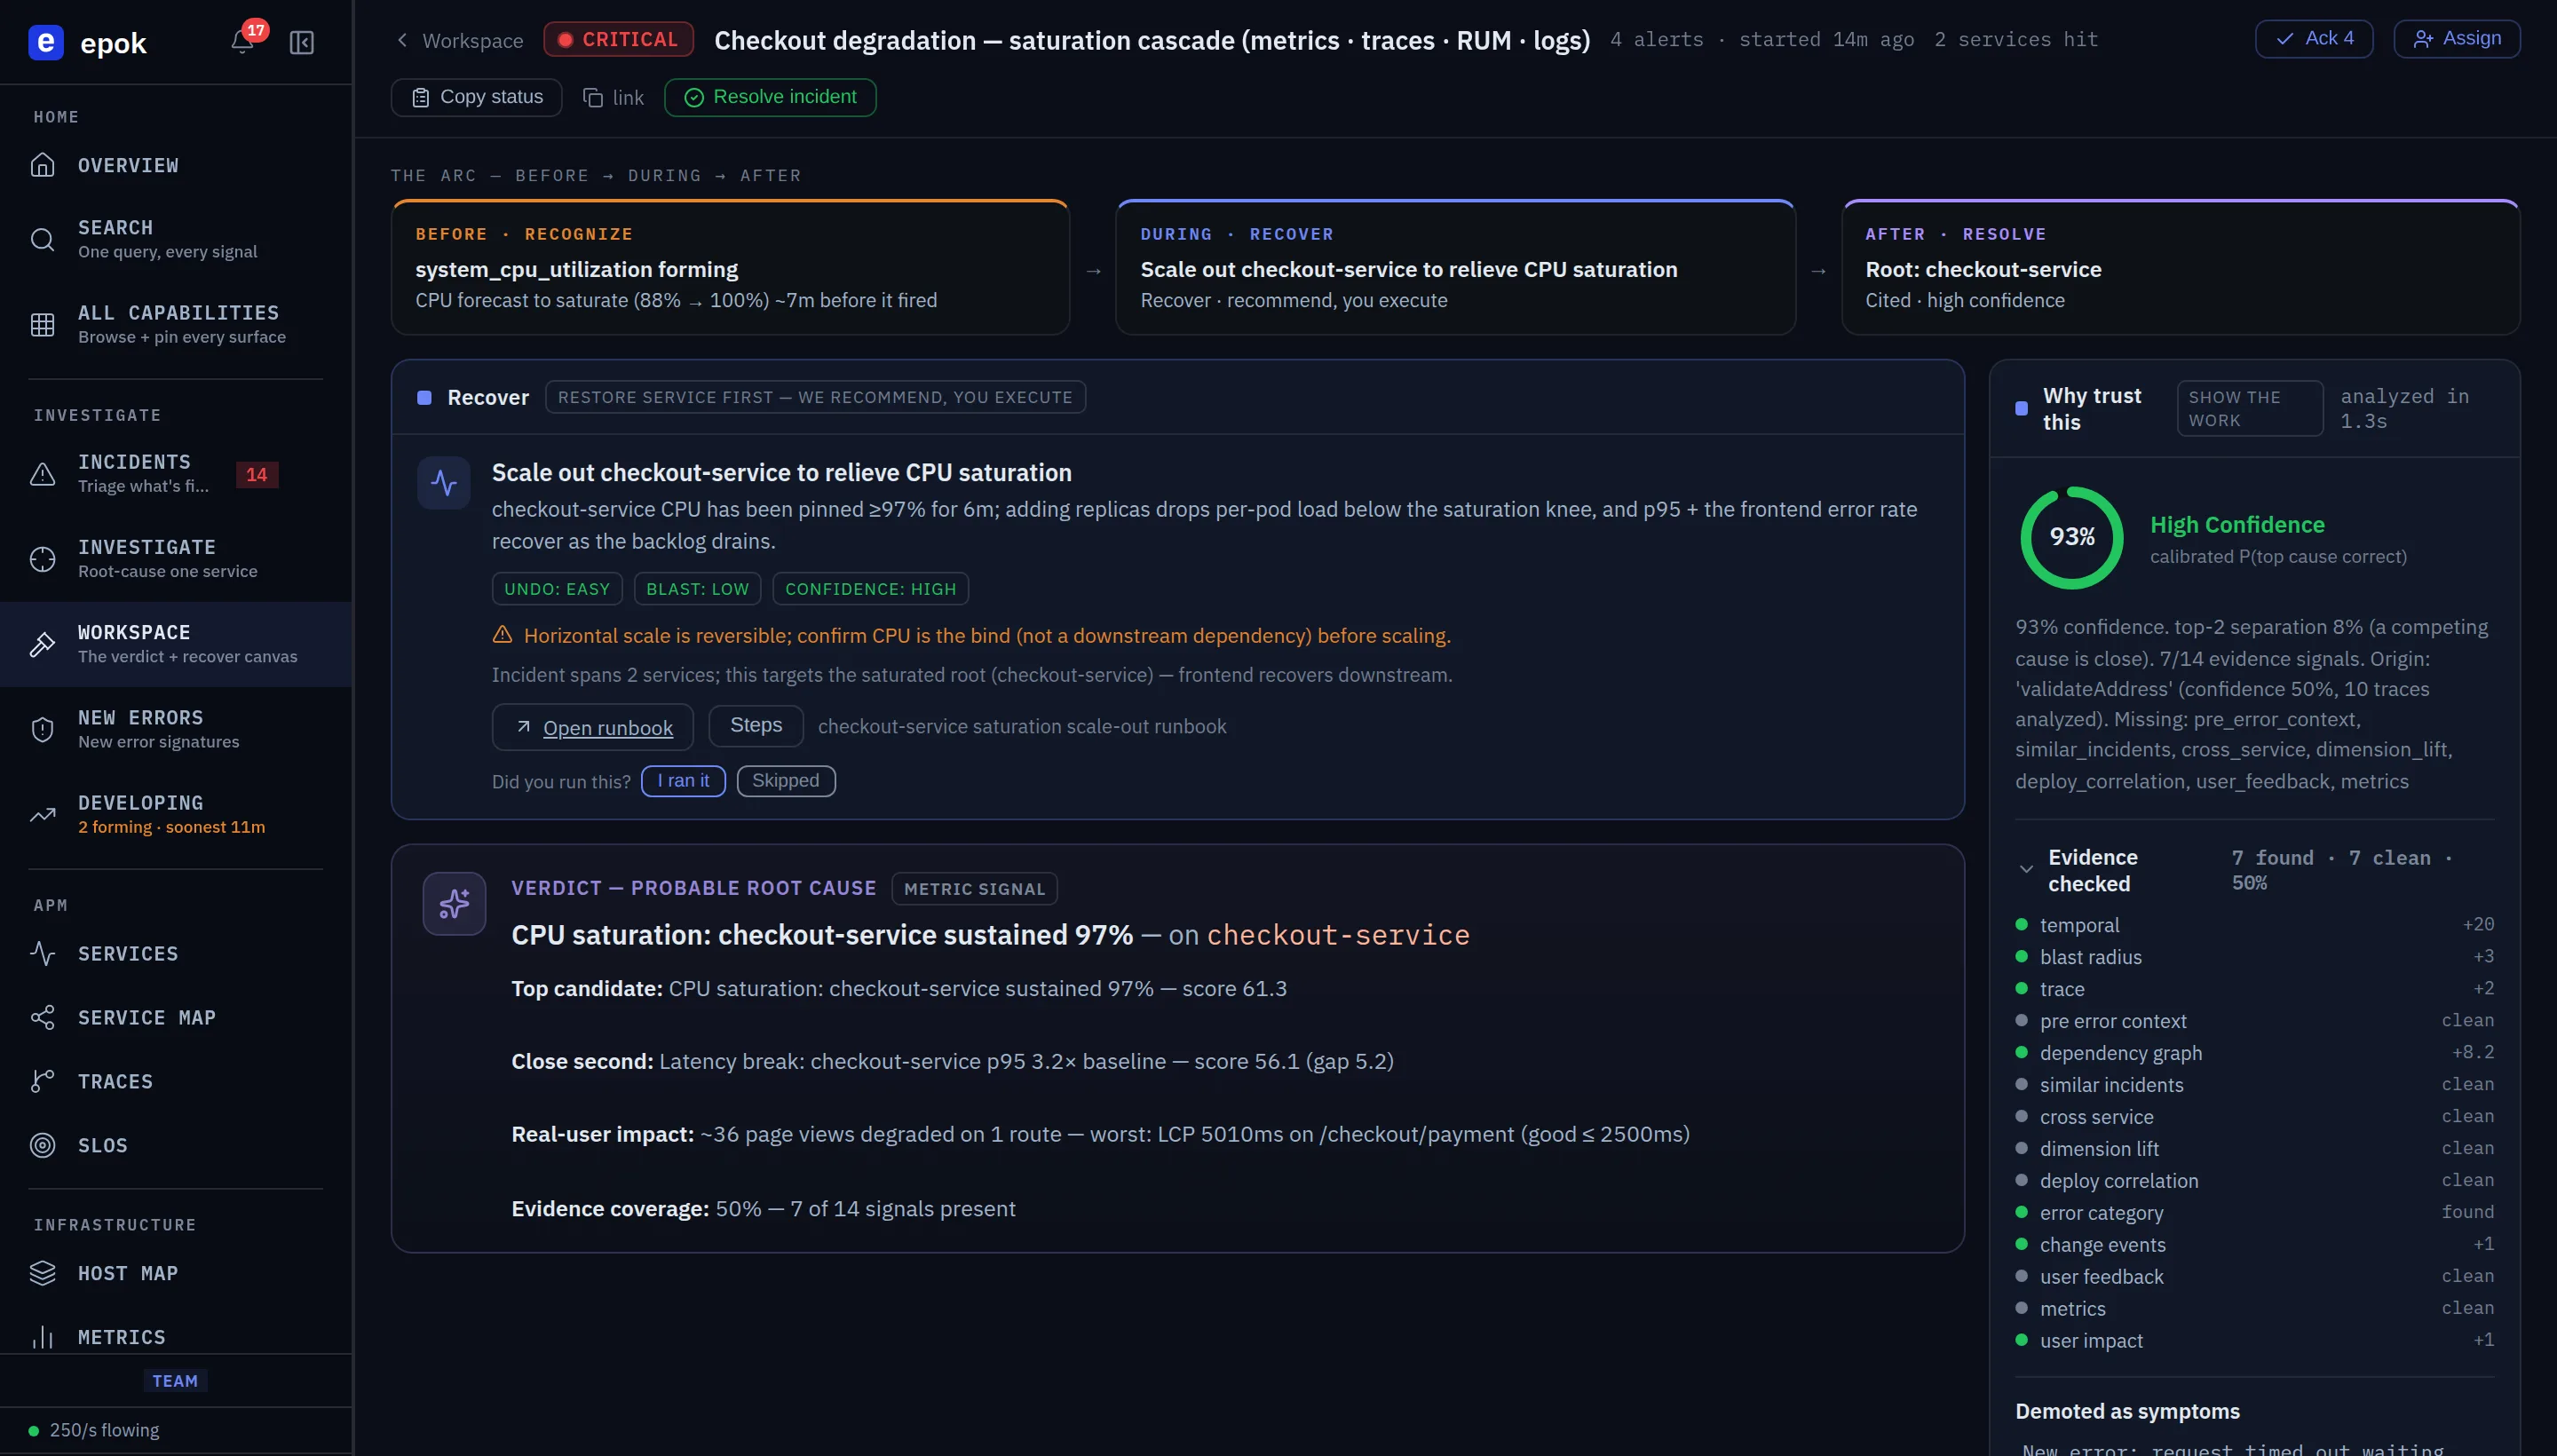
The request queue is accelerating toward saturation. Epok forecasts the breach, with live ETA and confidence shown, 12 minutes before anything pages.
The counterintuitive right move: shed the retries. And the guard that matters — rollback will NOT recover this. We recommend; you execute.
The verdict separates the trigger (a 40s blip, cleared) from the sustaining cause (the retry policy) — cited, with the last deploy exonerated.
It commits when the evidence is there. When it isn't, it says so.
Every other tool answers with confidence whether or not it has any. Epok abstains — and tells you exactly why. An honest "not enough evidence" is worth more than a fluent guess you have to disprove at 3am. No incumbent ships a verdict that knows the difference.
Detection runs automatically across your signals. On every tier, including the trial.
Point any shipper at one URL. Detection starts on the first matching line.
Each AI root cause links the exact log line that produced it. No narrative without proof.
Everyone else starts the clock when it breaks. Epok works before, during, and after.
You go looking for the problem.
Fast search and an assistant that summarizes results — but only when you ask. You have to know what to query; nothing fires until someone opens it.
The problem finds you — early.
Before it pages, Epok forecasts the breach with lead time. During, it recommends the reversible fix to restore service. After, it drafts the root cause — every claim cited.
The whole incident on one screen. No tab-hopping.
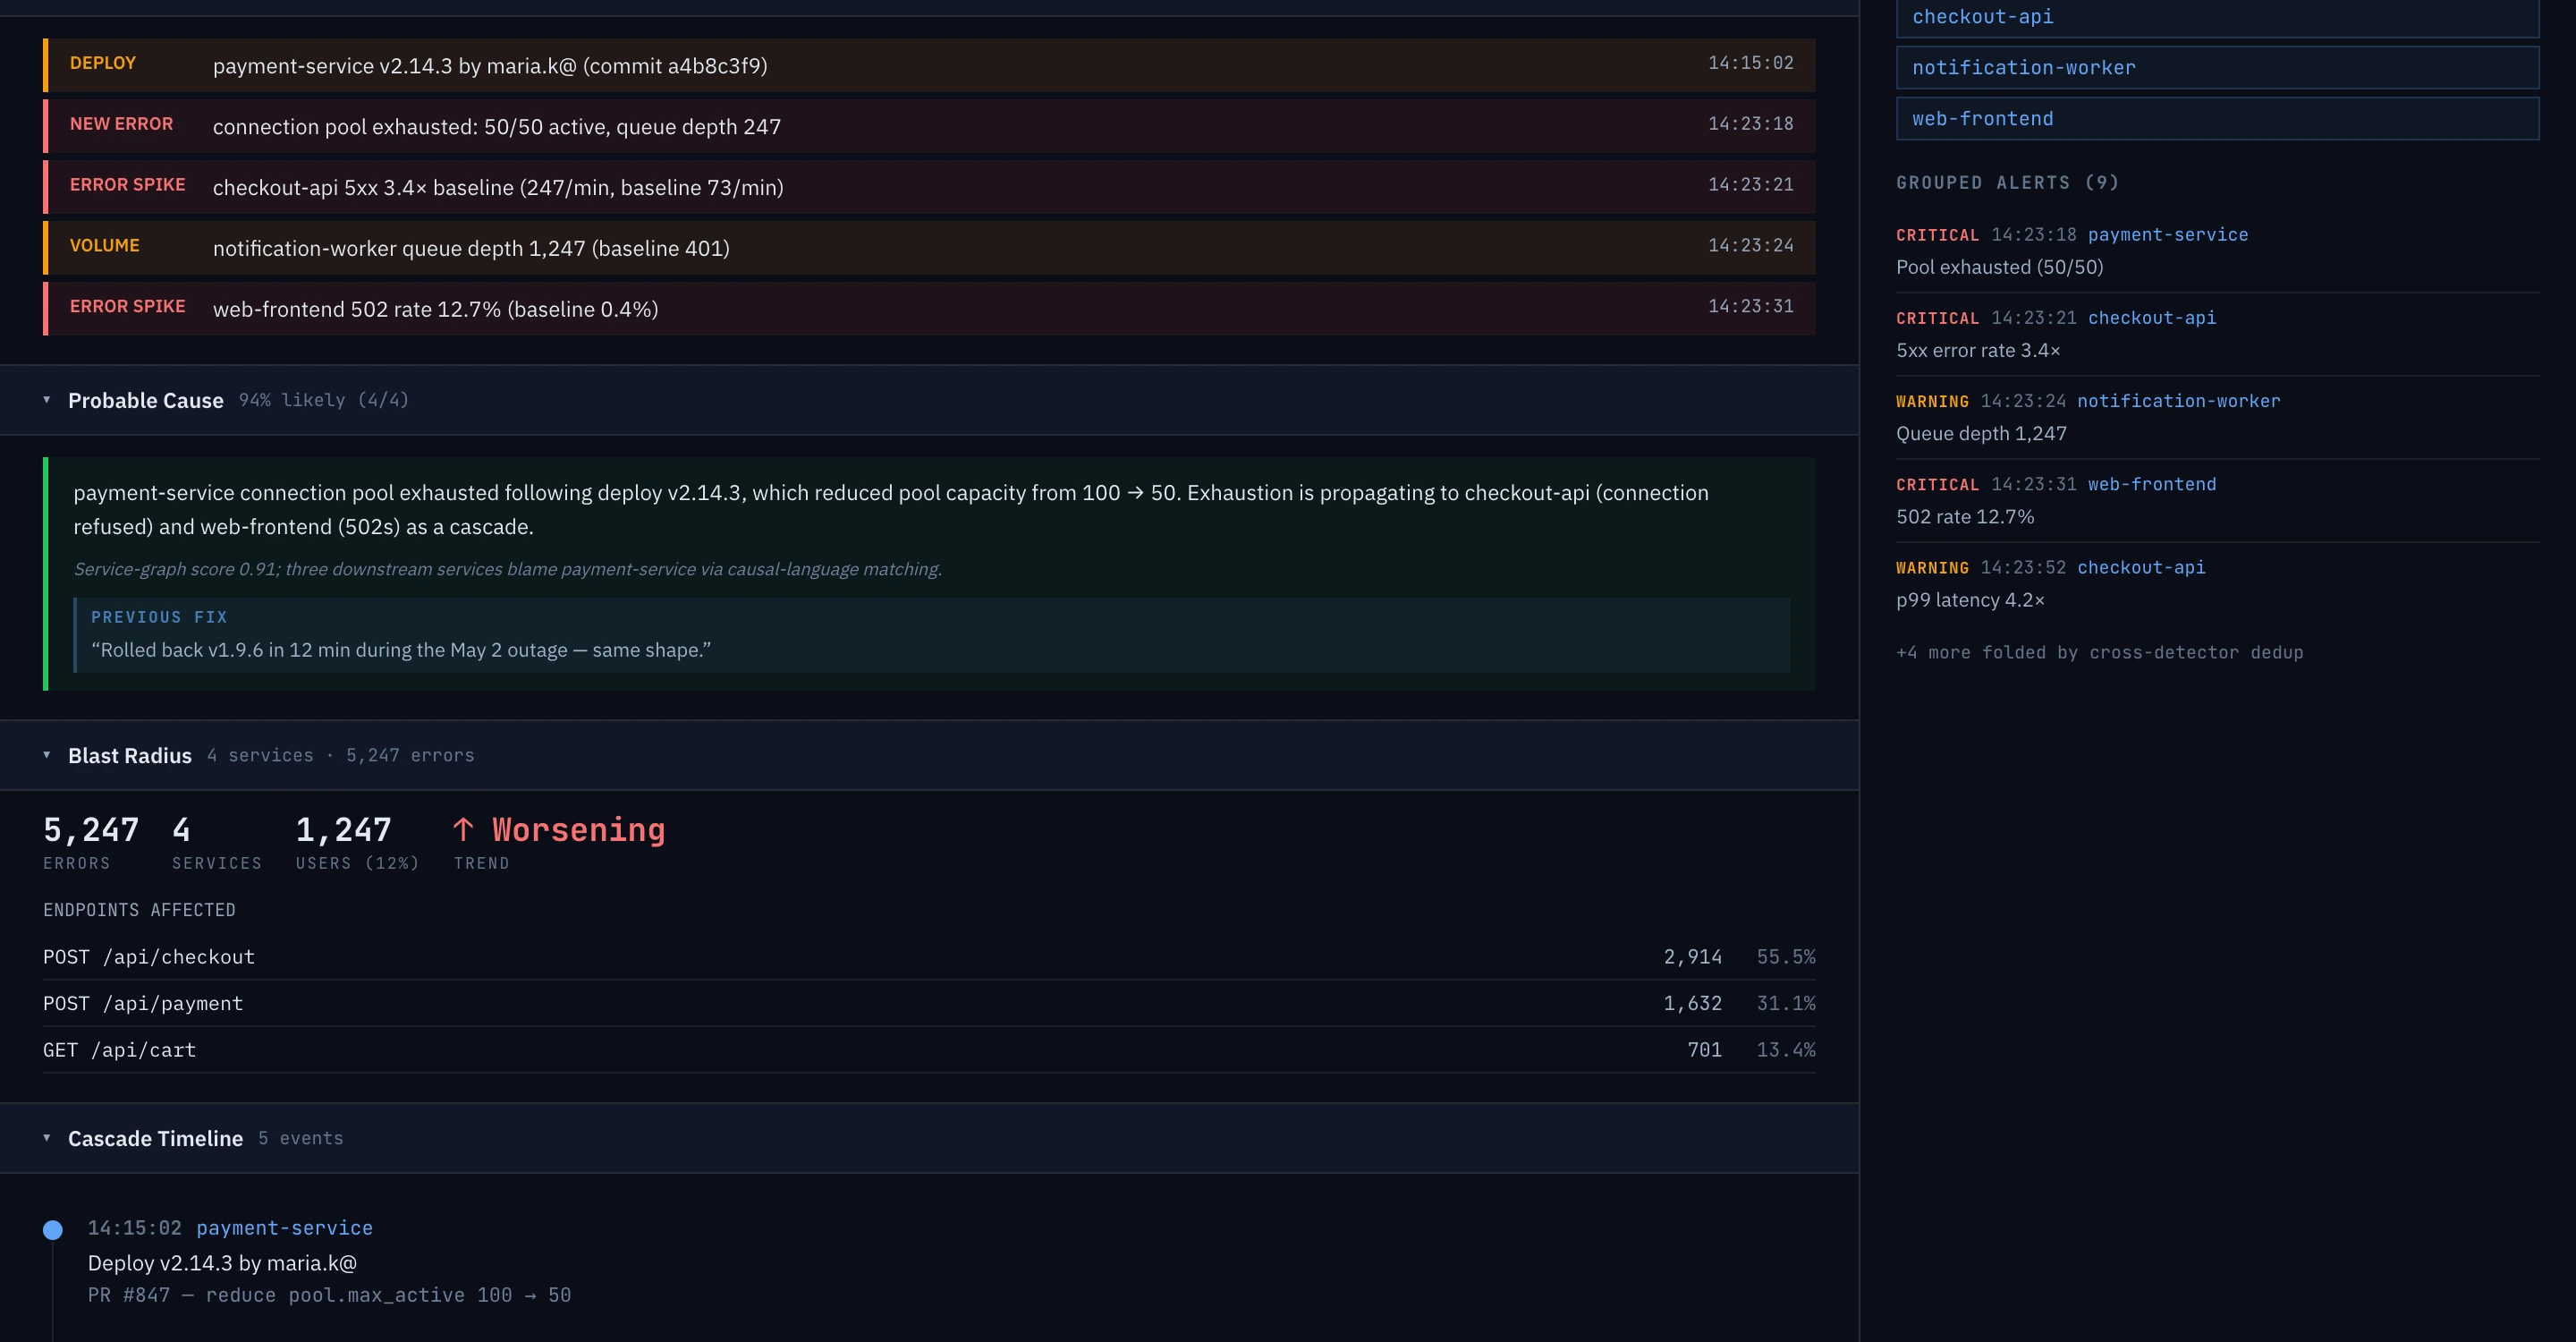
When an alert fires, Epok opens one canvas: the drafted root cause, what changed, the cascade timeline, the blast radius, and who's affected — every claim clickable back to the line, span, or metric behind it.
Watch the user hit the bug — from the trace that broke
Every session replay is linked to the backend trace by a shared trace ID. From a failing trace on this canvas, one click opens the recording of the exact user who hit it — seeked to the moment of failure, the lead-up a scrub away. Not two tools you cross-reference by timestamp. One click.
Customer impact, on every alert
Paste a roster (id, name, tier). Every alert scans the incident window for customer_id and joins to the roster. Your VP of CS reads the same alert as your on-call.
Plain English → search
Type "why is checkout slow in the last hour." AI translates it to a query, a 42-test validator forces time + limit, then we run it. Query is ground truth; the explanation sits beside it.
Postmortem draft, the moment it resolves
When the incident closes, a draft appears — triggering signal, cited evidence chain, matched playbook, and customer-impact rollup, pre-assembled. You edit; you don't author from a blank page.
Your runbooks, matched — not authored
Bulk-import from Confluence, Notion, GitHub, or Markdown. A citation engine surfaces the best-matching runbook — the specific steps land inside Slack, PagerDuty, and the deep RCA, not a link to a wiki.
Catch what actually pages you.
An error you've never seen
Surfaces messages that never appeared in your recent history — the first sign of a fresh failure.
A service gone quiet
Catches a service that stops logging when it normally logs steadily. Failure with no error — just absence.
Spikes, drops, flatlines
Flags volume that jumps, falls, or flatlines against each service's daily and weekly normal.
Many errors, one root
Groups errors that share a shape, so dozens of variants land as a single alert.
Crashing workloads
Surfaces crash loops, out-of-memory kills, and unschedulable workloads straight from their logs.
Failures that cascade
Connects upstream failures, retries, and circuit-breaker trips into the cascade they cause.
One incident. Not fifty alerts.
The pager is rationed by design. Repeats collapse, cascades arrive as one chain, and severity rides explicit thresholds the product enforces.
Fingerprint dedup
The same root cause never pages twice — repeats collapse into one alert with a fire count.
Incident grouping
A cascade arrives as one page with the full chain: db silent → API refused → frontend 502s.
Dynamic suppression
Repeat fires de-escalate on a widening window. New shapes still get full severity.
Severity rationing
Critical / Warning / Info on explicit thresholds the product enforces.
See it on data. No signup.
A 5-service app generates a continuous synthetic log stream into a public Epok tenant. Anomaly detection, RCA, and clustering run on it live — Epok working on real-shape data, not a marketing video.
Flat price. No surprise bill. No cardinality tax.
One meter for every signal — logs, metrics, traces, infrastructure, RUM, and replay on one bill. No per-host, per-query, or cardinality charges.
- 1 TB / month · 30-day retention
- 10 users · AI RCA included
- or $2,149/yr — save $239
- 4 TB / month · 30-day retention
- Unlimited users · SSO
- Priority support
Before you ask.
Ingest pauses, your data stays readable, and you add a card when you're ready. Nothing auto-charges.
No. A flat monthly price covers your included volume; overage, if you ever exceed it, is $0.20/GB, posted to your dashboard daily — never a surprise.
No. Log as many unique fields as you want; there is no per-series tax.
No. Detectors run automatically, and you can ask in plain English.
Logs, metrics, traces, infrastructure, RUM, and session replay — point any shipper at one URL. Many ingest formats — no agent of ours to install, no SDK to embed. Run it alongside your current tool during the trial.