Signals in. Answers out.
Every layer is inspectable.
Detection runs across your signals. When something fires, the investigation correlates logs, metrics, traces, infrastructure, RUM, and replay on one canvas by shared trace ID — and every layer is inspectable.
watch the whole mechanism on one incident — detection to cited cause, end to end · 2:54 · narrated
Anything that speaks HTTP.
Logs, metrics, traces, RUM, and session replay share one meter. Send server-side telemetry through Fluent Bit, Vector, Promtail, the OpenTelemetry Collector, syslog, CloudWatch subscription filters, or HTTP—no proprietary Epok server agent. RUM and replay use browser instrumentation. Telemetry is typically searchable within seconds of POST. Live tail measured p50 ~14 ms / p95 ~118 ms from arrival to screen (N=40, our production)—a measured product figure, not a competitive benchmark.
Field extraction without a schema.
Severity, service, hostname, and trace IDs are extracted automatically. Custom fields are stored as-is — no schema to declare, no cardinality tax. JSON is parsed; raw text is kept searchable.
Template clustering.
Every line is hashed to a stable template — variable values (UUIDs, IPs, timestamps) are abstracted out, leaving the structural shape. The same error across a thousand unique strings collapses to one pattern fingerprint.
Per-service rolling distributions.
A rolling distribution per service per hour-of-week. Seasonal patterns are learned, so a 3am spike on a quiet weekend service isn't measured against peak-hour production. Detection scores deviations against this baseline.
Detection runs in parallel.
Learned detection consumes the baselines and flags deviations; rule-based detection matches your stack's known failure modes from the first line. Everything runs in parallel, and each candidate carries a confidence score.
Fingerprint dedup + ack-aware quieting.
Candidates that share a fingerprint are folded into a single alert with a fire count. Repeated unacknowledged fires de-escalate on a widening window. Acknowledged-and-unresolved alerts suppress matching duplicates until they close.
Cascade graph across services.
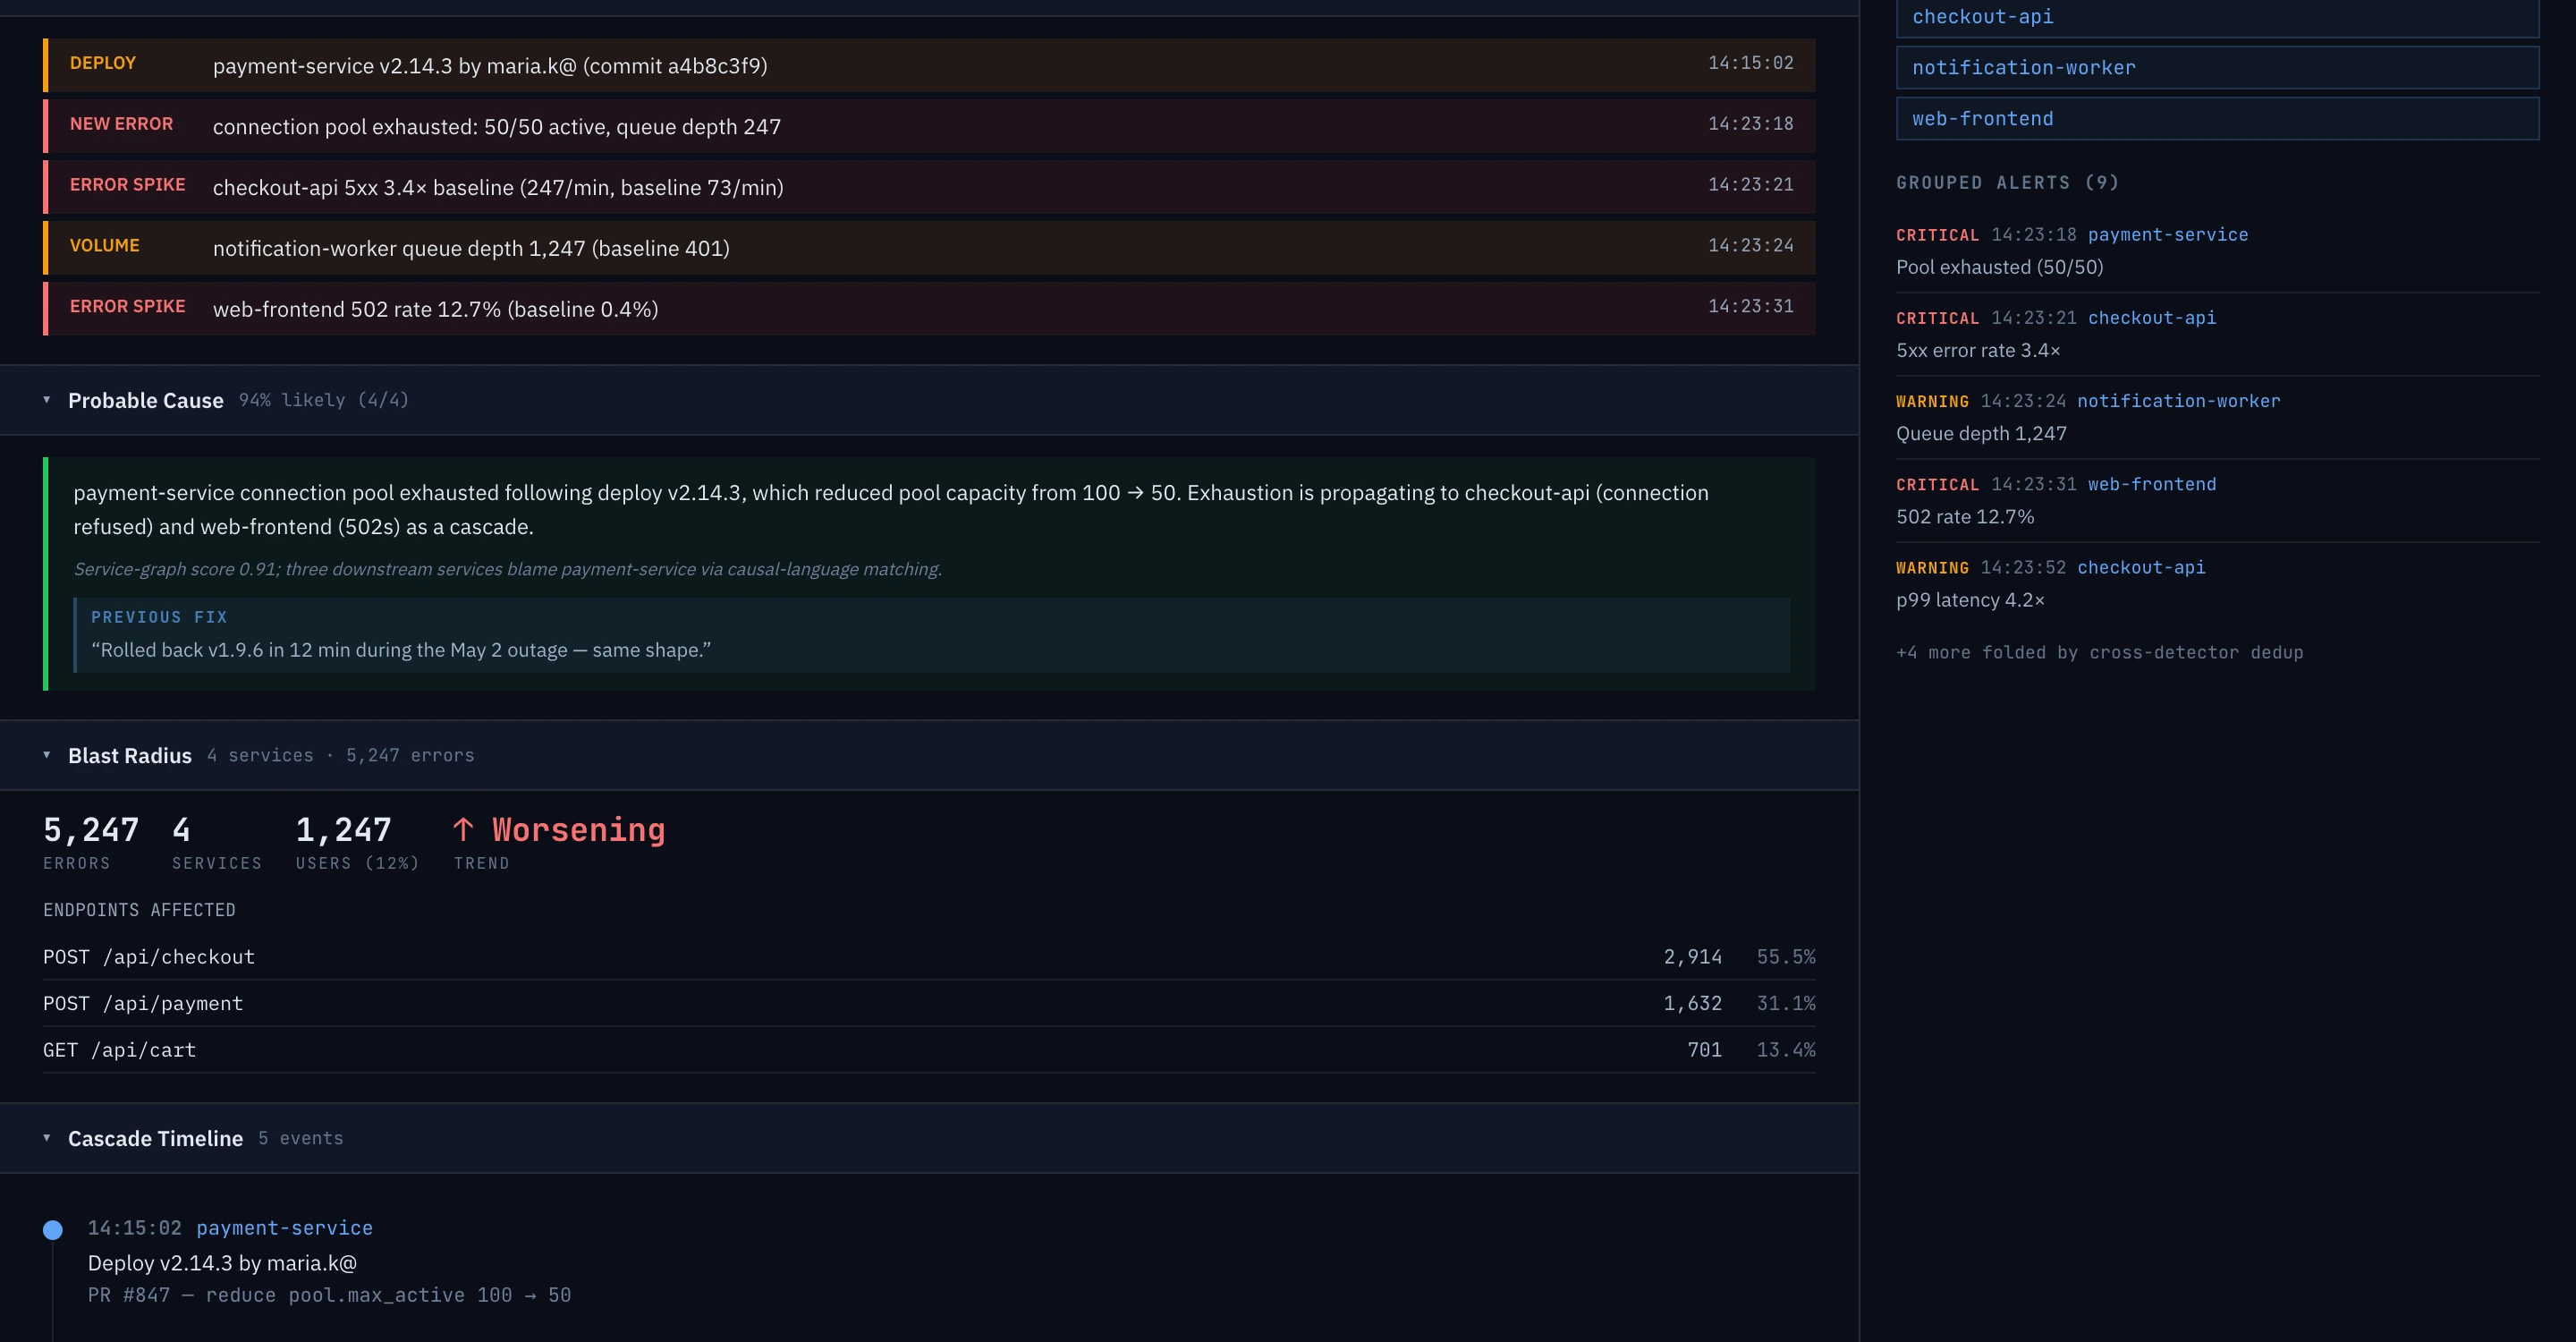
When two or more detectors fire on related services within a time window, they're folded into one incident. Logs, traces, RUM, and session replay are stitched by shared trace ID; metrics and infrastructure correlate by service and time window — "X called Y and got a timeout" is a directed edge. Cascades present as one page, not five.
Root-cause scoring + blast radius.
Each candidate cause gets a readable score — origin vs. victim classification, failure type (TIMEOUT / OOM / AUTH / CONFIG / CONNECTION / CRASH), and a recency-weighted evidence count. Blast radius (affected services, users, endpoints) and "what changed" (recent deploys, config diffs) are computed in parallel.
LLM writeup, cited evidence.
This layer drafts a 2–3 sentence probable-cause hypothesis from the diagnosis. Committed claims link to the relevant log lines, spans, or metrics. The output sent to Slack and PagerDuty explains what happened, the probable cause, and what to check first. AI is available on every tier, including the trial.
Grades its own certainty.
Before the page goes out, a calibration gate weighs the evidence against how confident the engine actually is. When the signal is strong, it commits the verdict. When it's thin, it says so — and tells you what to check next instead of guessing confidently. Confidence is measured against real outcomes, not asserted.
Want to see all ten in action?
The live demo runs the full pipeline on a synthetic log stream. Click any alert to see the candidates, the suppressed dupes, the cited evidence — every layer leaves an audit trail.