epok
DETECTORS

Twenty detectors.
Two intelligence layers.

Six statistical detectors learn your baseline. Fourteen rule packs fire from minute one. Every detector runs on every tier.

Start 14-day trialOpen live demo →
01

Statistical detectors

Learn your baseline over seven days, then alert on deviations.

new_errorSTATISTICAL

New Error Detection

Catches errors that have never appeared in your 7-day baseline. New means new, not an existing pattern getting noisier.

FIRES WHENAn error pattern not seen in the last 7 days appears 3 or more times within 5 minutes.
EXAMPLE ALERTNew error pattern "connection pool exhausted" appeared 8 min after deploy v2.14.3.
COLD‑STARTbaselines from day 7
silenceSTATISTICAL

Silence Detection

Catches services that stop logging when they normally log every N seconds. The most dangerous failure mode: no errors, just absence.

FIRES WHENA service that normally logs every ≤60s goes silent for 5× its observed median quiet window.
EXAMPLE ALERTpayment-service went silent for 4m 12s — normally logs every 8s.
COLD‑STARTbaselines from day 7
volume_anomalySTATISTICAL

Volume Anomaly

Detects spikes, drops, and flatlines in log volume vs daily and weekly baselines per service.

FIRES WHENLog rate ≥ 3σ from the seasonal baseline for the current hour-of-week.
EXAMPLE ALERTLog volume on api-gateway 3.4× baseline for hour 14 Wed.
COLD‑STARTbaselines from day 7 · backfilled at connect
log_rateSTATISTICAL

Log Rate

Detects sustained shifts in overall log throughput. Catches the slow-leak case that volume anomaly misses on short windows.

FIRES WHENRolling 1h rate ≥ 2σ from 30-day median for 3 consecutive windows.
EXAMPLE ALERTbilling-service log rate down 62% for last 3 hours.
COLD‑STARTbaselines from day 7 · backfilled at connect
golden_signalsSTATISTICAL

Golden Signal Monitoring

Latency, traffic, error rate, and saturation thresholds per service. The four signals that matter for any production system.

FIRES WHENp99 latency or error rate exceeds the learned per-service threshold by 30%.
EXAMPLE ALERTp99 latency on checkout 412ms vs 180ms baseline (× 2.3).
COLD‑STARTbaselines from day 7
outlierSTATISTICAL

Multi-dim Outlier

Outliers in log feature space. Catches subtle anomalies that single-axis thresholds miss.

FIRES WHENFires when a service's log-feature profile drifts significantly from its learned baseline.
EXAMPLE ALERTsearch-service: 41 outliers in last 10m.
COLD‑STARTbaselines from day 7
02

Error intelligence

Identify error messages that haven't been seen before. Cluster the ones that have.

pattern_clusteringERROR

Pattern Clustering

Groups errors with similar templates so many variants of the same problem cluster into one alert.

FIRES WHENCluster size grows by ≥ 5× its 7-day median in the active window.
EXAMPLE ALERTPattern pat_db_pool grew 12× — 84 fingerprints folded into 1 alert.
COLD‑STARTactive immediately
semantic_clusteringERROR

Semantic Clustering

Errors with different text but the same meaning fold together. "connection refused to database" and "cannot connect to postgres: ECONNREFUSED" become one pattern.

FIRES WHENTwo error clusters that mean the same thing in the alert window — merged into one fire.
EXAMPLE ALERTDB connection errors across 4 services merged into one cascade.
COLD‑STARTactive immediately
changepointERROR

Changepoint Detection

Permanent traffic shifts after a deploy read as a new baseline, not a prolonged anomaly. No false-positive storms after a real product change.

FIRES WHENSustained shift ≥ 40% lasts for 6h+ — baseline is rolled, not paged.
EXAMPLE ALERTVolume +58% on orders-service since 14:15 — baseline updated.
COLD‑STARTactive immediately
03

Domain rule packs

Nine curated packs encoding the most common incident patterns. Fire from minute one.

kubernetesDOMAIN PACK

Kubernetes

70+ rules for OOMKilled, CrashLoopBackOff, ImagePullBackOff, FailedScheduling, evictions, probe failures, and more.

FIRES WHENContainer restart count ≥ 3 in 5m, OR readiness probe failures ≥ 5 in 60s.
EXAMPLE ALERTbilling-7c4b OOMKilled (3rd restart in 4m) — node memory pressure.
COLD‑STARTrule pack · fires from minute one
awsDOMAIN PACK

AWS

Lambda throttles, RDS connection saturation, SQS queue depth, NLB target health, S3 SlowDown errors, IAM throttling.

FIRES WHENLambda throttle errors ≥ 10/min, OR RDS connection pool ≥ 90% saturation.
EXAMPLE ALERTRDS db-primary connections at 198/200 — sustained 4m.
COLD‑STARTrule pack · fires from minute one
serverlessDOMAIN PACK

Serverless

Cold starts, invocation timeouts, init duration drift, memory exhaustion across Lambda, Cloud Run, Functions.

FIRES WHENCold-start ratio > 35% over 10m for an invoked-hot function, OR timeout ≥ 1%.
EXAMPLE ALERTcheckout-fn cold-start ratio 47% (was 8%) — deploy correlation.
COLD‑STARTrule pack · fires from minute one
databaseDOMAIN PACK

Database

Connection pool exhaustion, deadlocks, slow queries, replication lag, schema migration errors, transaction aborts.

FIRES WHENPool active/max ≥ 0.9 for 60s, OR replication lag > 5s, OR deadlock storm.
EXAMPLE ALERTpayment-db pool exhausted (20/20, 84 waiting) — query p99 4.7s.
COLD‑STARTrule pack · fires from minute one
dependencyDOMAIN PACK

Dependency

Upstream service failures, circuit breaker trips, retry exhaustion, cascading failures between services.

FIRES WHENCircuit breaker opens, OR retry rate > 5%, OR 2+ downstream services in error state.
EXAMPLE ALERTstripe-client circuit OPEN — 7 retries exhausted in 90s.
COLD‑STARTrule pack · fires from minute one
webDOMAIN PACK

Web / HTTP

5xx surges, 4xx anomalies, TLS handshake failures, gateway timeouts, slow responses, payload anomalies.

FIRES WHEN5xx rate > 1% for 60s, OR 4xx auth-related > 100 distinct IPs in 5m.
EXAMPLE ALERTapi-gateway 502 surge — 47% of POST /checkout in last 90s.
COLD‑STARTrule pack · fires from minute one
securityDOMAIN PACK

Security

Brute-force auth, privilege escalation, anomalous access patterns, secret-leak signatures in logs.

FIRES WHEN≥ 5 auth_failed events for the same principal within 60s, OR sudo from a non-baseline user.
EXAMPLE ALERTBrute-force on user admin from 203.0.113.42 — 23 failed in 90s.
COLD‑STARTrule pack · fires from minute one
searchDOMAIN PACK

Search

Slow Elasticsearch / Opensearch queries, index issues, scoring anomalies, cluster yellow/red transitions.

FIRES WHENQuery p99 ≥ 5s, OR shard count drift ≥ 5%, OR cluster status → yellow.
EXAMPLE ALERTsearch-cluster status YELLOW · 3 unassigned shards.
COLD‑STARTrule pack · fires from minute one
infrastructureDOMAIN PACK

Infrastructure

Disk pressure, memory pressure, swap usage, kernel errors, hardware failure signatures.

FIRES WHENDisk ≥ 90%, OR swap > 0 sustained 5m, OR kernel error pattern detected.
EXAMPLE ALERTnode-prod-04 disk at 94% — 8GB free, rate -12GB/h.
COLD‑STARTrule pack · fires from minute one
04

SLO & custom

When you need a rule the built-in detectors don't cover.

slo_burn_rateSLO + CUSTOM

SLO Burn Rate

Error budget burn-rate alerts with short + long window confirmation. Warned before the SLO breaches, not after.

FIRES WHEN1h burn ≥ 14.4× AND 5m burn ≥ 14.4× — fast burn rule (2% budget in 1h).
EXAMPLE ALERTcheckout-availability SLO: 1h burn 18.2× — budget exhausts in 3h.
COLD‑STARTactive from first SLO definition
custom_rulesSLO + CUSTOM

Threshold + Composite Rules

When you need a rule the built-in detectors don't cover. Threshold and composite rules let you write your own — no DSL to learn, just LogsQL.

FIRES WHENAny LogsQL query that returns a result over your defined window + threshold.
EXAMPLE ALERTservice=payment AND msg~"refund.* > 1000" — 12 hits/h (was 0).
COLD‑STARTactive on save
CUSTOM RULES

When the built-in detectors don't cover it.

Two ways to extend: threshold rulesfor "alert when this LogsQL query crosses a number," and composite rulesfor "alert when threshold X AND detector Y are both active." No DSL to learn — just the same LogsQL you use to search.

threshold rulePOST /api/v1/tenants/<id>/rules

Fires when a LogsQL query crosses a number.

Same query language as search. Window, condition, severity, and routing are all explicit. Hold-down with for_duration_seconds eliminates flapping.

{
  "name": "Payment refund burst",
  "query": "service:payment AND _msg:refund AND amount > 1000",
  "condition_op": "gt",
  "condition_value": 5,
  "window_seconds": 300,
  "severity": "critical",
  "for_duration_seconds": 60,
  "cooldown_seconds": 600,
  "channel_ids": [12, 8]
}
ALSO USEFUL FOR
  • Auth-failed bursts: level:warn AND _msg:"auth failed" > 50 in 1m
  • Retry-rate spikes: service:checkout AND _msg:retry > 10× baseline
  • Specific value thresholds: latency_ms > 5000 for any service
composite rulePOST /api/v1/tenants/<id>/composite-rules

Fires when two or more signals are simultaneously true.

Combine a threshold rule with a detector firing, or two detectors at once. Express "API is degraded AND the database is in a known bad state" as a single page — not two.

{
  "name": "API degraded + DB struggling",
  "expression": {
    "op": "and",
    "conditions": [
      { "op": "threshold",
        "query": "service:api AND status_code:>=500",
        "comparator": "gt",
        "value": 10,
        "window_seconds": 300 },
      { "op": "detector_active",
        "detector_type": "database_intelligence" }
    ]
  },
  "severity": "critical",
  "cooldown_seconds": 300
}
LEAF OPERATORS · BRANCH: and / or / not
  • threshold — a LogsQL query crossing a number in a window
  • alert_firing — a specific alert dedup-key is active
  • detector_active — a built-in detector type is firing
TIER LIMITS

Trial: 5 threshold + 5 composite. Team: 20 threshold + 5 composite. Growth and Enterprise: unlimited.

VERSION CONTROL

Rules are plain JSON. POST from CI to apply, GET to diff. Put your alert config in the same repo as your service code.

TEST BEFORE DEPLOY

Run the query in Explore against your last 24h first. The condition fires on the count of hits in the window — exactly what you see in search.

IN-APP EDITOR

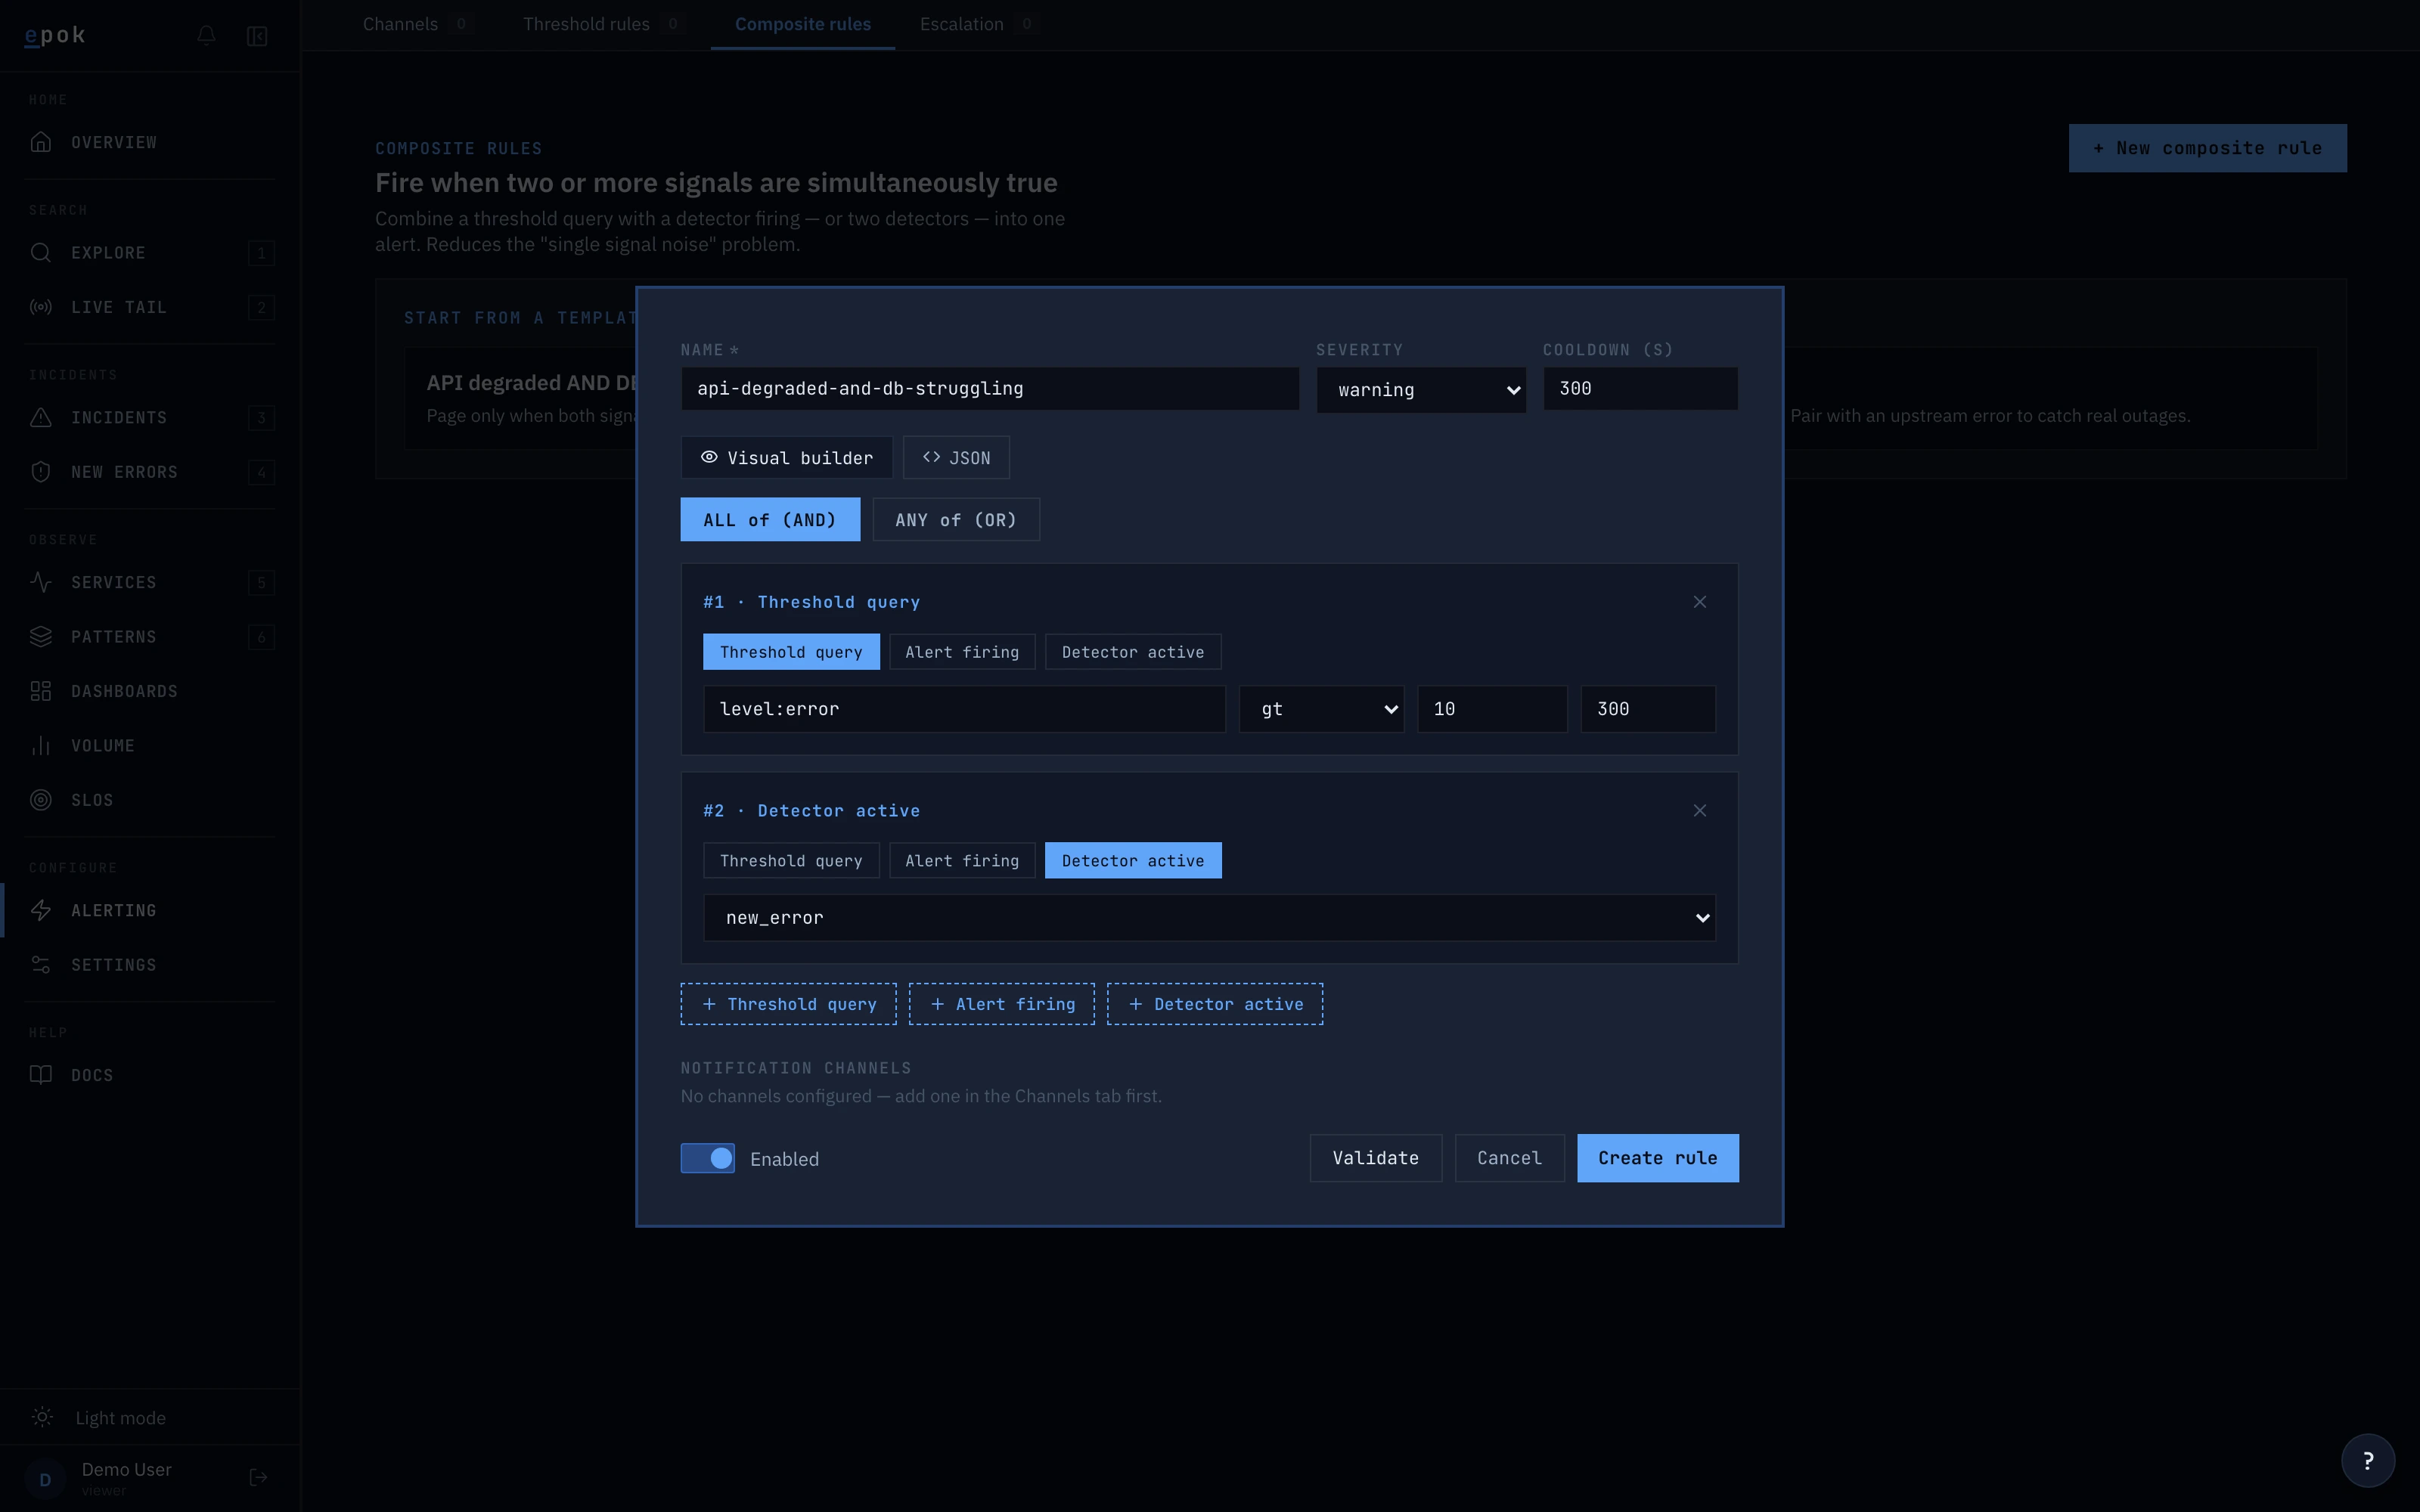
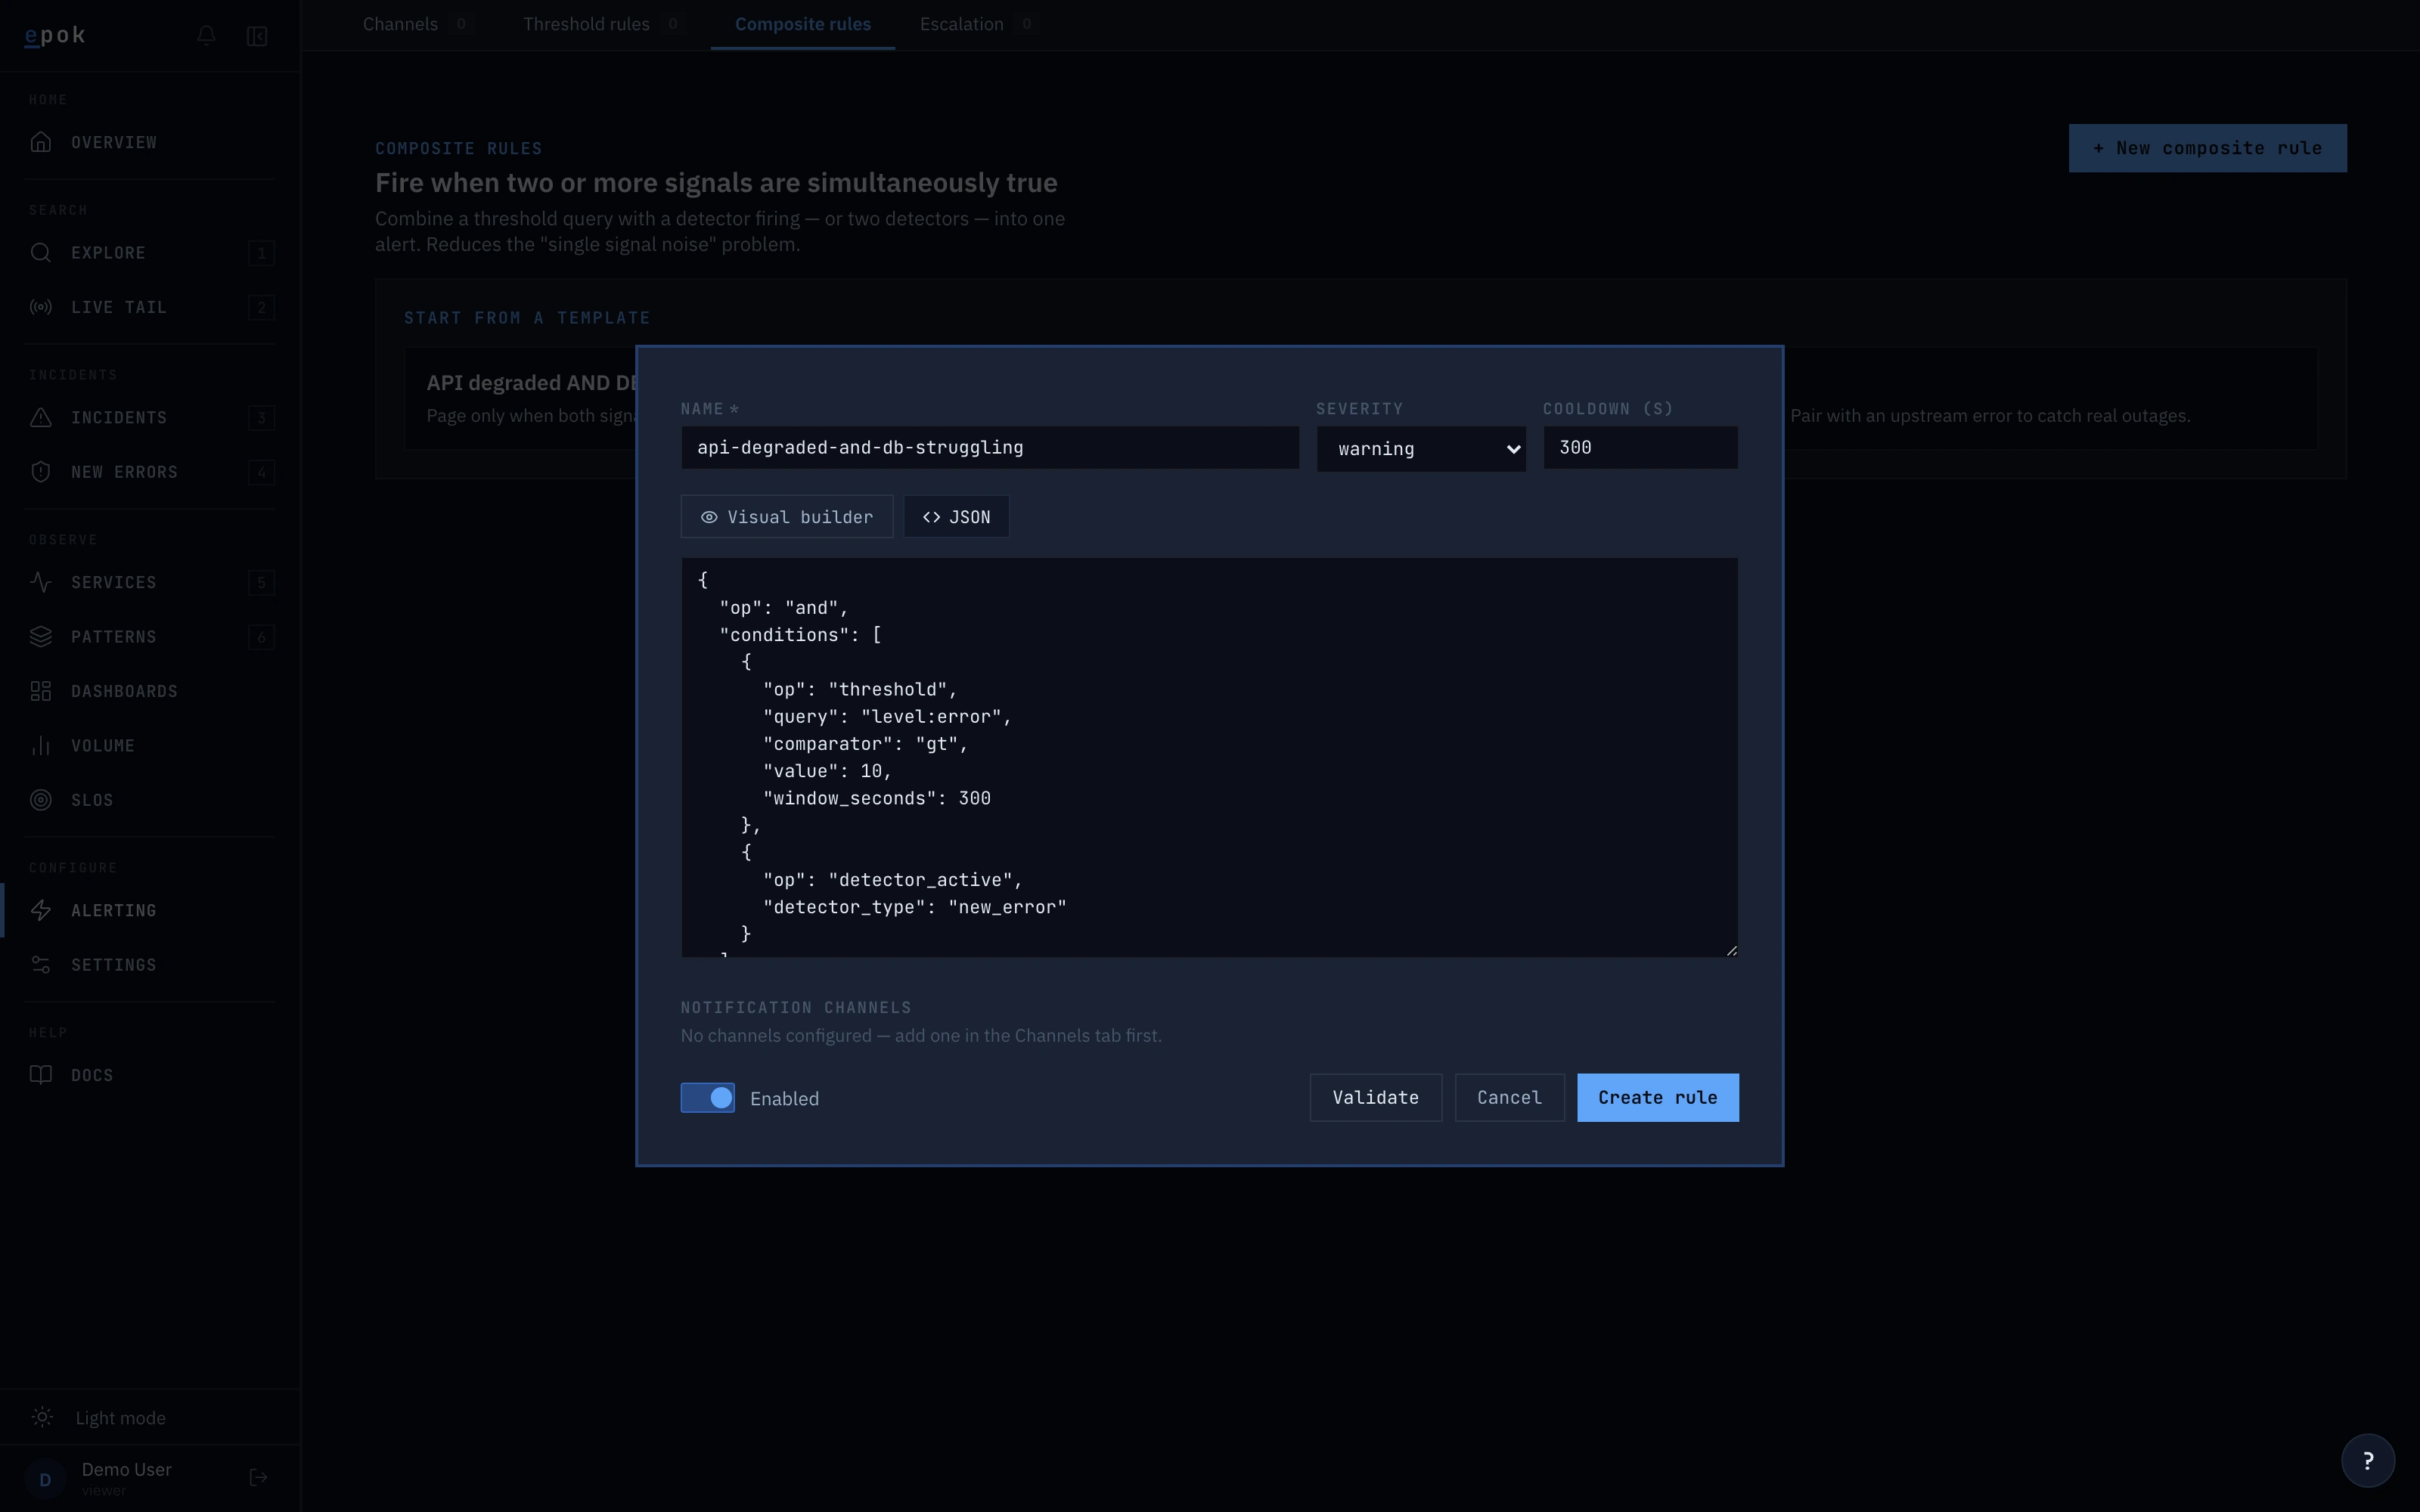
Visual builder or JSON — you pick. Both speak the same schema the API does.

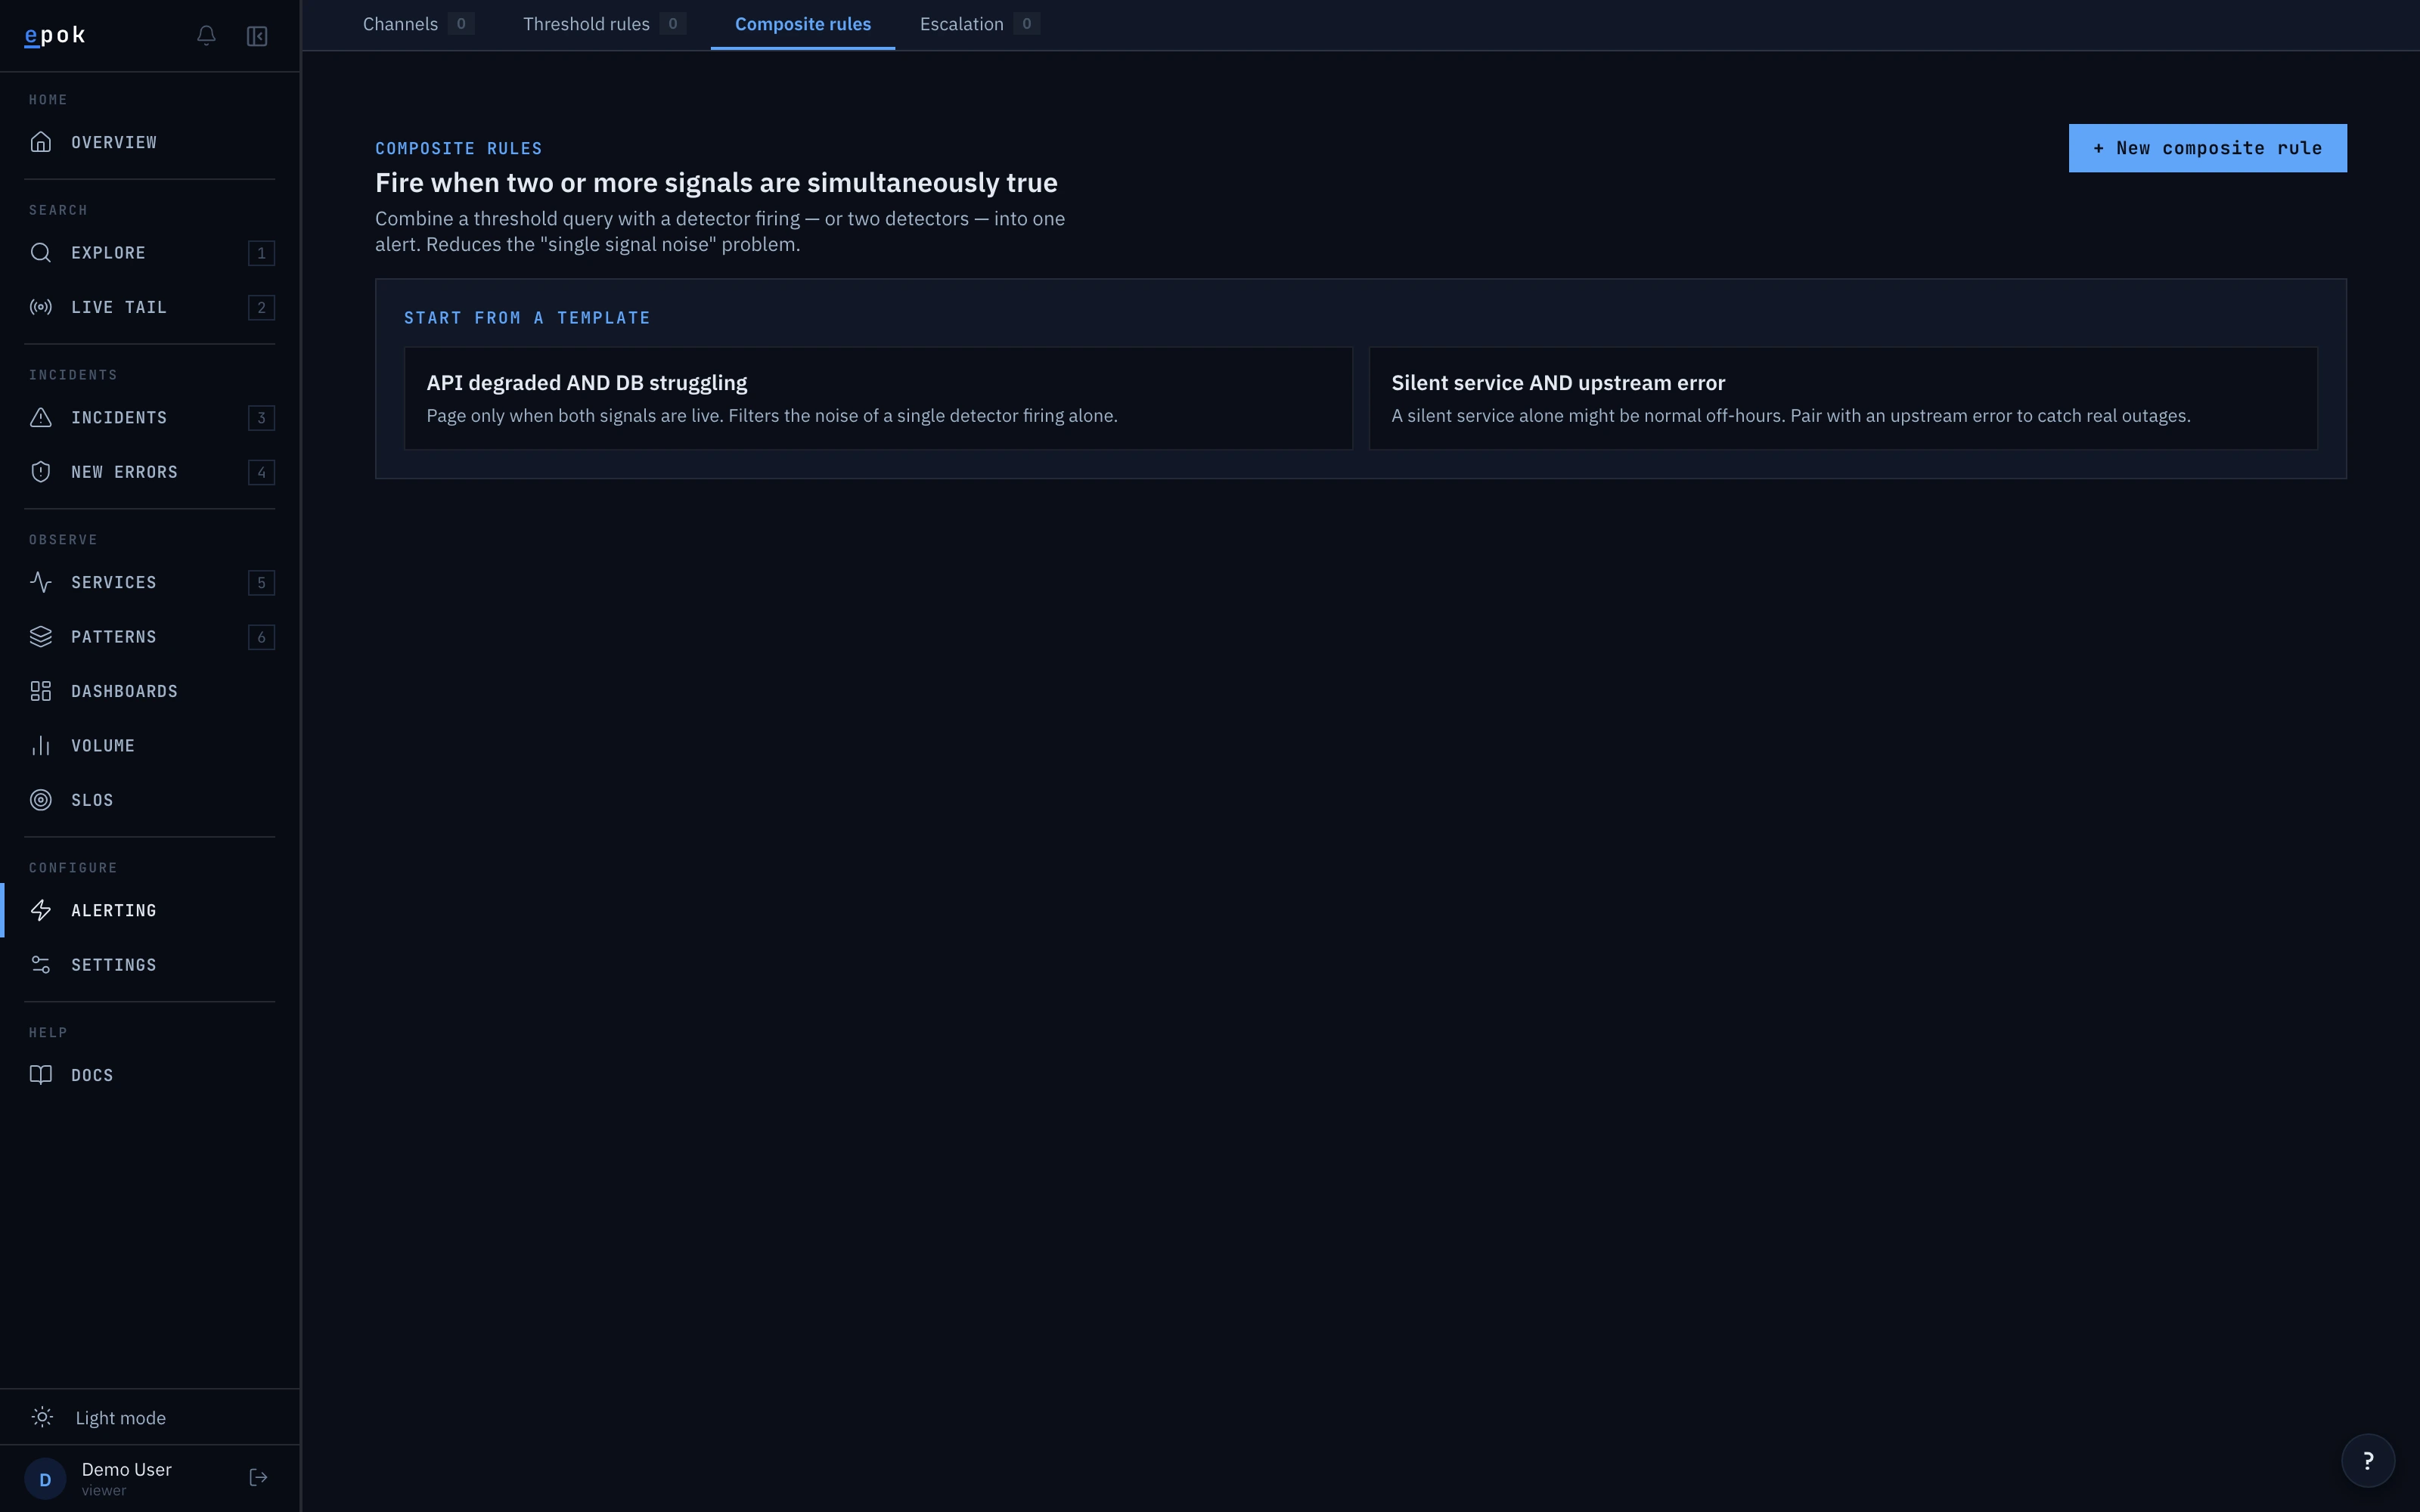
Composite rules tab — empty state with two starter templates: API degraded AND DB struggling, and Silent service AND upstream error
Start from a template — or blank.
Composite rule visual builder — AND/OR toggle, two conditions (threshold LogsQL query + detector_active), inline add buttons for more leaf types
Visual builder. Add threshold queries, detector firings, or alert dedup-keys as conditions; combine with AND or OR.
Composite rule JSON view — the same rule rendered as the JSON the API expects, editable in place
JSON view of the same rule. Round-trips both directions.