Inspect the evidence.
Make your own call.
Explore how Epok detects, investigates and explains an incident. Start with the worked scenarios in the live demo, then test the fit with your own telemetry.
From the first signal to the next action.
Forecasts the breach — before it pages
Live ETA + confidenceFor saturation and exhaustion, Epok projects the breach from its live trajectory and pages with an ETA and confidence — while you can still act, not after it fires.
See it on the demo → ↗Recommends the reversible fix
We recommend · you executeDuring an incident — for known failure shapes, matched from your runbooks and built-in playbooks — Epok recommends the fix that restores service first, and flags the guard that matters, like when a rollback won't recover it. We recommend; you execute.
See it on the demo → ↗Shows when the evidence is incomplete
Evidence · uncertainty · next checksSee the probable cause, the evidence behind it and what is missing. Epok can withhold a verdict when the signals do not support one. Evaluate both outcomes against incidents your team understands.
How we measure it →Predictable pricing
Included volume + published overageTeam starts at $199/month with 1 TB included. Growth includes 4 TB for $599/month. Published overage is $0.20/GB; daily ingest limits apply. No separate host, query or cardinality charge.
See pricing →Follow telemetry as it arrives
Live logs + trace spansStream live logs and trace spans and search the last hour without waiting on a query.
Open live tail on demo → ↗No-parse ingest
8 formats verifiedConnect a supported open shipper and start exploring your logs. Follow the integration guide for the protocol and fields your workload needs.
See ingest formats →Alert lifecycle + ack
Ack · snooze · escalate · auditOperators acknowledge with comment + timeout; escalation pauses on ack and re-fires when the timeout expires. Unacked criticals re-page on a configurable cadence. Bulk-ack for burst incidents. Activity log per action.
See the alert inbox → ↗Alert-noise reduction
Semantic dedup · re-fire suppressionSimilar errors are collapsed into one alert using semantic similarity. Patterns that re-appear after going quiet don't re-page; they update the existing alert.
See it in the inbox → ↗One investigation surface
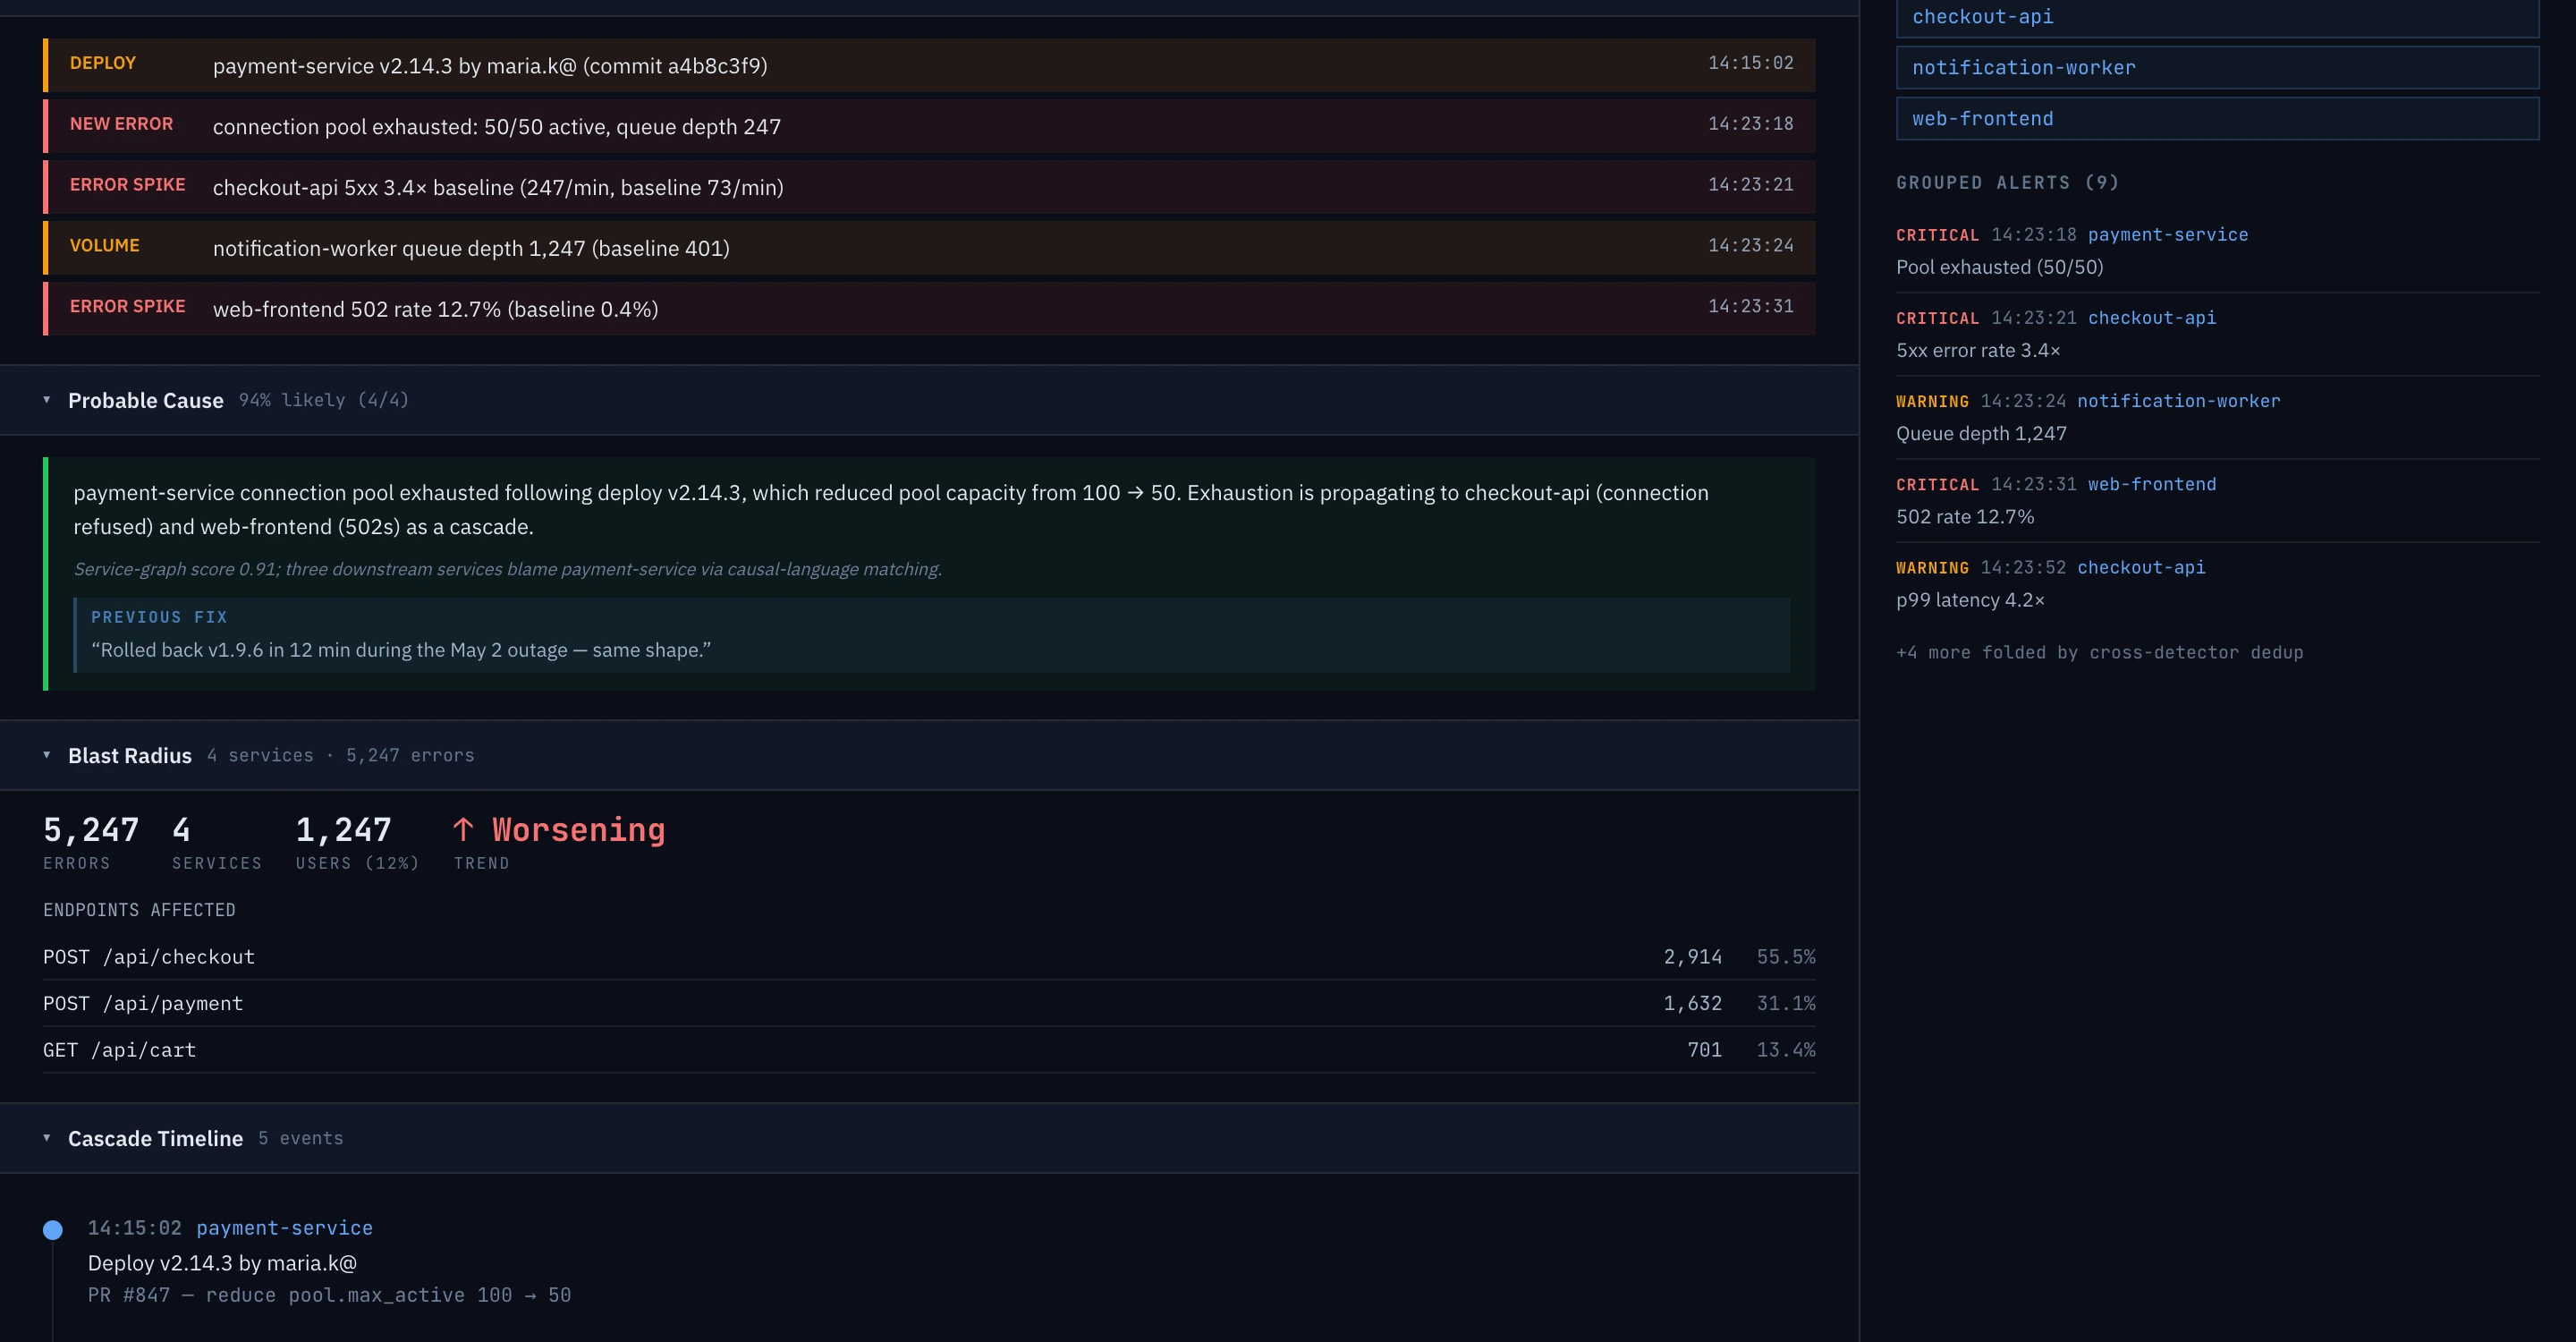
6 signals · 1 pageLogs, metrics, traces, infrastructure, RUM and replay correlated on one canvas: RCA · triggering chart · notification status · cascade timeline · causal graph · deep RCA · postmortem · architecture context — no tab-hopping.
Open an investigation → ↗Ask in English
Question → query → evidenceAsk a question in plain English, then inspect the generated query and source results alongside the answer.
Ask the demo → ↗Explainable AI
Source evidence you can inspectFollow citations to the log line, span, metric or context behind a probable-cause explanation. Check the evidence yourself before deciding what to do.
See cited evidence → ↗Explore an incident. No signup.
Inspect the demo, then connect a representative service in the 14-day trial.